Presenting complex content in an approachable, intelligible, digestible, memorable, and attractive way is essential for anybody working with content, from marketers and designers to journalists and other media workers. One of the best ways to do this is to create and embed an infographic. Infographics are concise visual representations of complicated information that frequently include images, brief descriptions, and data visualizations (charts, tables, and maps). Infographics are highly successful at communicating complicated topics, making them a popular information source. With the emergence of the web and new digital platforms like AR and VR, this strategy has been elevated to a novel level with the introduction of interactive infographics (Also termed animated infographics with user interaction applications). The big question is, what is the application of an interactive infographic in the digital world?
What is an interactive infographic?
An interactive infographic is an infographic that incorporates some kind of interaction, such as animation effects triggered by the users’s clicking and scrolling. These are examples of interactive marketing that require human participation to initiate action.
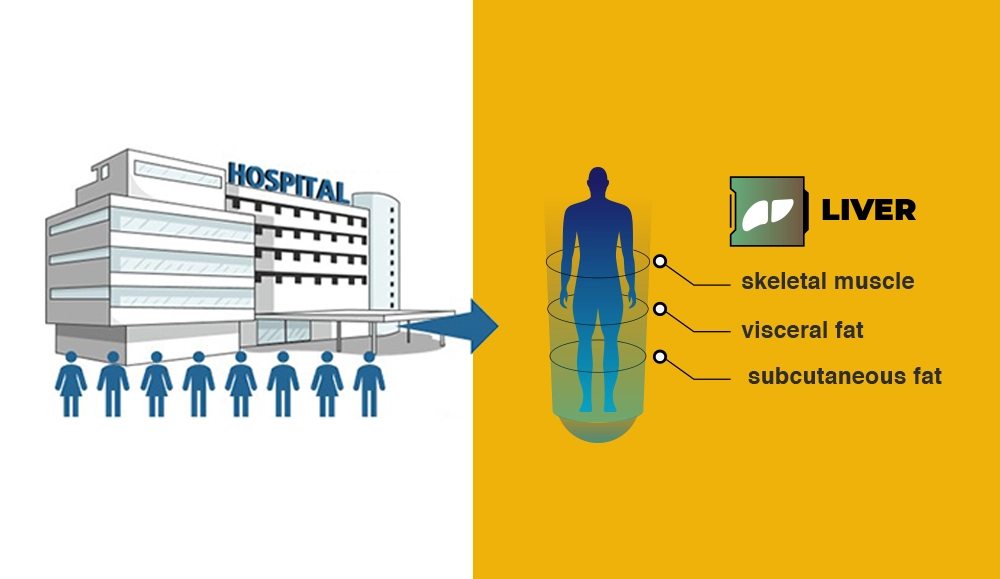
An interactive infographic created in Vev.design
Interactive infographics provide a dynamic and exciting method to communicate facts and information. Unlike static infographics, interactive infographics allow visitors to interact with numerous features such as charts, maps, and animations. This can frequently include clicking, hovering, or dragging to disclose additional information or change the data meaningfully. Interactive infographics are widely utilized in digital media, such as websites, presentations, and online resumes to provide the viewer with an immersive and instructive experience.
These interactive versions draw attention when compared to static infographics. They provide an immersive dimension to the medium, increasing viewer engagement. To truly captivate your audience and provide an exceptional learning experience, you need interactive infographics.
In addition, interactive infographics have become an essential part of the marketing strategy. Storytelling plays a key role in selling products or raising funds for companies or startups. Definitely, for a company, having a privilege in marketing compared to the rivals will draw more customers in the long-run and this type of introducing products and services would be more effective. It is, therefore, reasonable to conclude that the usage of infographics is crucial in today’s techniques of presenting textual information.
What is the best way of creating an interactive infographic?
In order to create an interactive infographic, you need two parts:
1- you have to create beautiful graphs, 2D or 3D models by an expert graphic designer. Inmywork’s experienced staff can assist you in creating stunningly vector-based or 3D models with a professional style in scientific issues.
2- In the second action, you have to arrange the ready-made models and graphs in a specific platform to make them interactive and then add them to your website. Several companies provide such services like Webflow and Vev and you can create them easily.
Recent Journal Cover Designs


Leave a Reply